DASHBOARD
The Dashboard of Autopilot provides excellent monitoring capability of the complete setup.
Various graphs and statistics of events, performance and system information of clients and application is evidently made available to the user. It comprises of following components through which the data is available for monitoring.
Overview:
This tab comprises of data and various graphs as follows:
Site Information: Here the information of number of configured APS, Online APS and number of clients are connected.

Discovered Devices: In this table all the discovered devices are listed with Names, IP addresses and Actions performed over them. Every device discovered and displayed here should be APPROVED for it to be connected to APS network and ready for configuration.

Events: Here all the events occurring on the network of AP are continuously streamed both graphically and digitally. Graphical spikes can be helpful in representing the network know how the network is behaving. Any config error also come as an event with the reasons mentioned due to which config apply was failed. Check the highlighted event
Clients: Number of clients connected to specific frequency (2.4 GHz or 5 GHz) and total number of clients at a given time on the present day are graphically streamed.

Through-Put: TX, RX of each client and total Through Put of all clients against each channel is graphically represented. User can hover over the graph and get more granular details.

Top APS: Here the top five APS connected to Autopilot’s network are graphically displayed along with numbers of clients and Traffic in respective frequencies (2.4hz or 5hz).User can select Clients tab or Traffic tab to see the Top Aps based on number of clients or amount of traffic.
Top ap based on Clients

Top ap based on Traffic

Top Clients: Top five clients connected to APS, with highest traffic flow, are represented graphically.

Clients by Radio/Band Type: Pi chart representation of the radio types of the Clients. This will show pie chart based on percentage of 2.4 GHz and 5 GHz clients connected to autopilot network. Another pie chart
Is plotted based on types of clients like 802.11a,802.11b/g/n,802.11ac


Channel Distribution: Channel distribution between master and member aps are plotted as below. This helps to know which channels are being used and how many APs are using the channels.
Clients by Wlans: Pi chart representation of all the Clients and Wlans.This helps to know instantly know the load on the Wlans.
Clients by Device type: Pi chart representation of device type (Respective Platforms) of the Clients.This classifies the clients based on types like Andorid, windows clinets,Linux ,Ipad,Iphone clients etc.

Access Points:
This tab contains details like Performance, System details, Client details etc of all the APS connected to Auto Pilot. Under Access Point there are 4 tabs which are as below
Overview: In this tab all the APS’s details like Name, MAC address, IP Address, Model, number of Clients, Power, Channels, State of radio.
Performance: In this tab along with MAC and IP, Link speed, Total TX (Transmit from APS) and Total RX (Received to APS) are displayed.
eg: If AP transmits data at the speed of 10mbps then its TX is equal to 10mbps
System: Here along with Name, IP address and model, Firmware, Backup, CPU usage, Memory, Uptime and synced configurations on all APS are displayed respectively. This helps to know the performance of the APS. Config Synched option let user know whether the configuration of the AP is synched with the configuration done on Master. If there is any config sync issue it will come as red x.
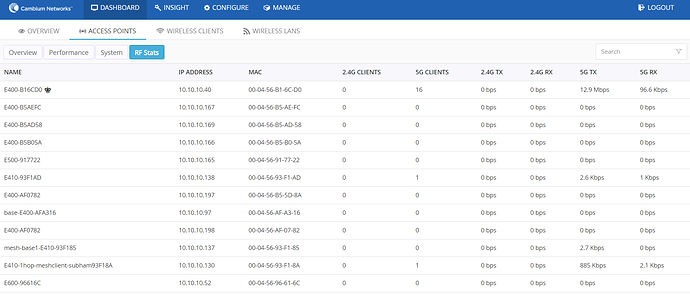
RF Stats: In this list the number of of 2.4G Clients, 5G Clients, TX to 2.4G clients, TX to 5G clients, RX from 2.4G clients, RX from 5G clients is displayed. Tx stats signifies the downlink data speed to the client and rx signifies uplink data speed from the client.
Wireless Clients:
This tab represents all the details of wireless clients such as vendor type, Wlans, Vlans, RF Stats etc
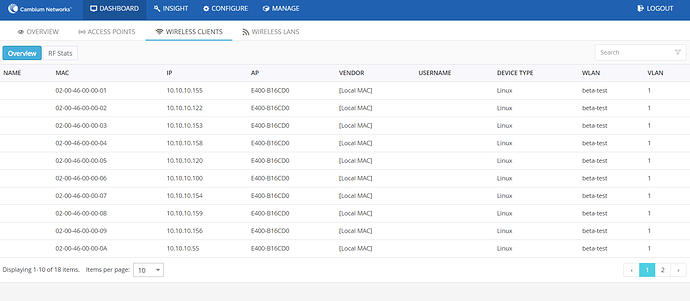
Overview: The details in this tab include Name, MAC, IP, Vendor type of clients, Usernames (WPA2 enterprise and guest access), Device type ( Platform) of Clients, list of Wlans to which clients are connected, Vlan information of respective Wlans.
RF Stats: This tab includes details like frequency Type, Radio types,Signal, SNR, Physical Rate, TX and RX of Clients along with names, MAC and IP addresses of clients.
Note:- Less the number in signal better is the signal. -20 is better signal than – 70
SNR- Signal to Noise. More the SNR better is the signal quality.
Wireless Wlan :-
Here all the configured Wlan’s details will be available. The details of each column is as below
GROUP- Name of the group under which the Wlan is created. Wlan group is used to club single or multiple Wlans and then push the Wlan configs to selected Aps.
SSID – SSID of the wlan.
SECURITY – Security of the Wlan. It can be Wpa2-psk,Wpa2-Enterprise,Open
Tx - The actual data speed of downlink data. AP to clients
Rx- the actual data speed of uplink data. Clients to AP.


