Ahh yes. ePMP AX… a whole new generation of ePMP which will STILL display incorrect information about the radio you are logged into. ![]()
2 Likes
Really? Are you really saying that Cambium is unaware of the problems with the GUI?
2 Likes
Some screenshot
steps to reproduce?
Power up an ePMP radio and log into the web interface…
Or is that real ? You just never know on ePMP but I don’t think it’s real

2 Likes
Maybe I did not take enough coffee in the morning. But what exactly is wrong in this screenshot?

^^This^^ is the most glaring one that happens all the time. On the bench or in the field, I’m “logged into” a radio, and it goes off, but I don’t know even that, because I can still move around the (maze of unnecessary) menus and sub-menus… I make changes to the radio’s settings, then I go to apply the changes, and there is some error (which there is often anyway) but then I open a prompt to ping the IP of the radio, only to discover it’s not replying. I call our tech, and he’s got the radio that I’m “logged into” off the roof and in the van. I’ve been “logged in” and administering a radio that isn’t even powered on.
So, given that – it’s difficult to trust any of the other info (which may or may not be correct) when there are the kinds of incorrect info that brubble and others have been pointing out.
AND – it’s difficult to trust that anyone at Cambium takes us seriously, or even understands our needs. I’m not trying to be mean… but people have been BEGGING for years for someone to understand the problems we face, and we get a reply that “can you provide some screenshots to reproduce?” years down the road, and that question from Cambium was on a thread where the OP was in fact reporting that they “could not download the tech file” because the GUI was all wrong.
So to recap:
The OP said “I can’t download a tech file, the GUI is all wrong” on a 400c
I then said “a new generation of ePMP which still displays incorrect info”
and Cambium then asks me “can I explain or provide screenshots to reproduce?” what I mean.
…makes a guy go “Hmmmm”.
3 Likes
So if you are asking me what I think… overall for me – there is so much incorrect or questionable info – and there is such a LACK of info displayed in locations where we can see it, it throws everything into question.
For me, the main overall problem with the GUI is having 20 pieces of info, separated into 17 different menus and sub-menus. There’s no dashboard with an “at a glance” view, no “single pane of glass” type of interface like there is with every other brand.
For example, no place to even see if the SA was accidently left on (because that’ll tear down a radio). I mean, how hard would it really be to take the Disabled/Enabled status from the Tools → Spectrum Analyzer sub-sub menu, and to display that info on the top of the menu bar, next to the GPS and ‘Internet Connectivity’ and ‘Active users’ icons?
And nearly 9 years later, there still is no way to see basic diagnostic info we need to know what’s going on – no single pane on the AP to see a list of clients with their latency, or speedtest results, or even to see who is transferring data – no way to adjust & SAVE the columns or their widths in Monitor → Wireless screen. The GUI shows a bunch of unnecessary info displayed, while having important information missing or scrolled off the screen. And we can’t even adjust and save the columns or their sizes.
And 9 years later, still no functional eDetect, no reliable way to even do a WiFi site survey and to see what local interferers (such as the client’s own router or wifi security cameras) that the client might have in their home.
I am not trying to be negative, I’m trying to be helpful. The GUI needs a major overhaul… and much of it seems like it should be basic webdesign. Doesn’t seem to like it’s deep firmware coding, seems like it’s basic ‘reformat the info already known’ into a more informative display.
2 Likes
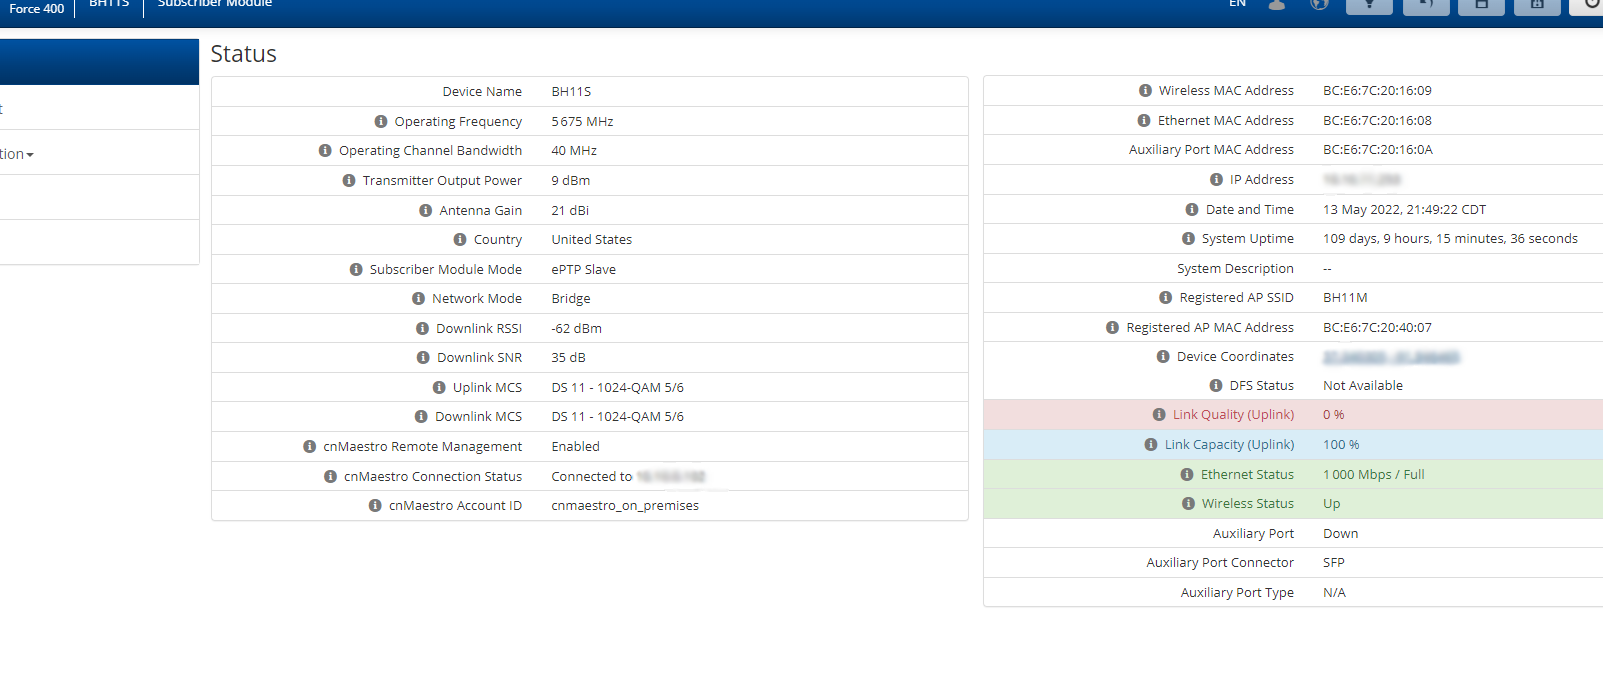
I’m going to jump on the bandwagon here and mention that I too, often see incorrect info displayed in the ePMP GUI. Often it’s the ethernet link status or, on the 400 series dashboard the uplink “quality” will often display 0% even though the radio is modulating at DS 11 on the uplink.
I too, have had the experience of making changes to a radio that went offline while I was in the GUI only to find out that it had been down most of the time I thought I was logged in.
The ePMP GUI at present displays most of the info we need. The big problem is that there is no useful dashboard or single pane of glass interface. Want to see frame utilization and correlate it to throughput? You can’t do that in a very meaningful way while bouncing back and forth between pages and hoping that they will update in a reasonable time frame. It also isn’t possible to see what SMs are consuming frametime or bandwidth in any meaningful way at a glance.
The current state of the ePMP GUI is old and tired - hugely in need of a refresh to be more useful. It’s also still incredibly slow on mid-level android devices.
2 Likes
Here’s an example from today – Force400 PTP link. I log in, of course the main ‘dashboard’ doesn’t show me the info I need to see, so I have to click Monitor and Throughput (and that screen ONLY shows me throughput… because what WISP would ever want to see multiple pieces of diagnostic info at the same time, right?)
Anyway - so I get there and this backhaul is usually carrying 200-250 Mbit during the mid-day. But then… there suddenly is a 17,000 Mbps spike on the uplink… which is kinda unlikely. And even 5 minutes or so after that spike, the GIU also still says the uplink is 0.0 kbps

Just to be clear – the 400c’s work great for us, they are FAST and they function pretty well. I’ve posted MANY good, detailed, glowingly good reports about them here and on the Facebook WISP groups. I’m a fan, and I’m NOT trying to be negative. But the dearth of useful and accurate info, in the bleak GUI, with every item separated into it’s own individual sub-menu… get’s a guy scratching his head.
4 Likes
This topic was automatically closed 365 days after the last reply. New replies are no longer allowed.