Hello friends, I tell you that I am configuring a PMP 450i and when doing a spectrum analysis, I have realized that in different equipment, locations, etc. you have different results. Perhaps anyone knows what each spectrum analysis means? For example, I upload several samples of two PMP 450 located at different points.
If you could tell me if when you see these different spectra of different equipment, the information traffic will have great loss of information or everything goes smoothly?
Hello Mack,
Are you saying that the spectrum analysis is different among equipment facing different directions? That’s to be expected because each AP is facing different interfering sources. Also, I only saw one sample that you uploaded.
I am not allowed to upload more than one image, because it is new?
My doubt is, that resulting spectrum after analyzing for more than 300 seconds, which means, the traffic is good, bad, there is interference or there is no interference.
In other APs, I have completely null results, that is, no bars are displayed in the graph. What does it represent?
Sorry, I’m not quite following. It would be easier if you contact your local RTM or channel partner to have a discussion over the phone.
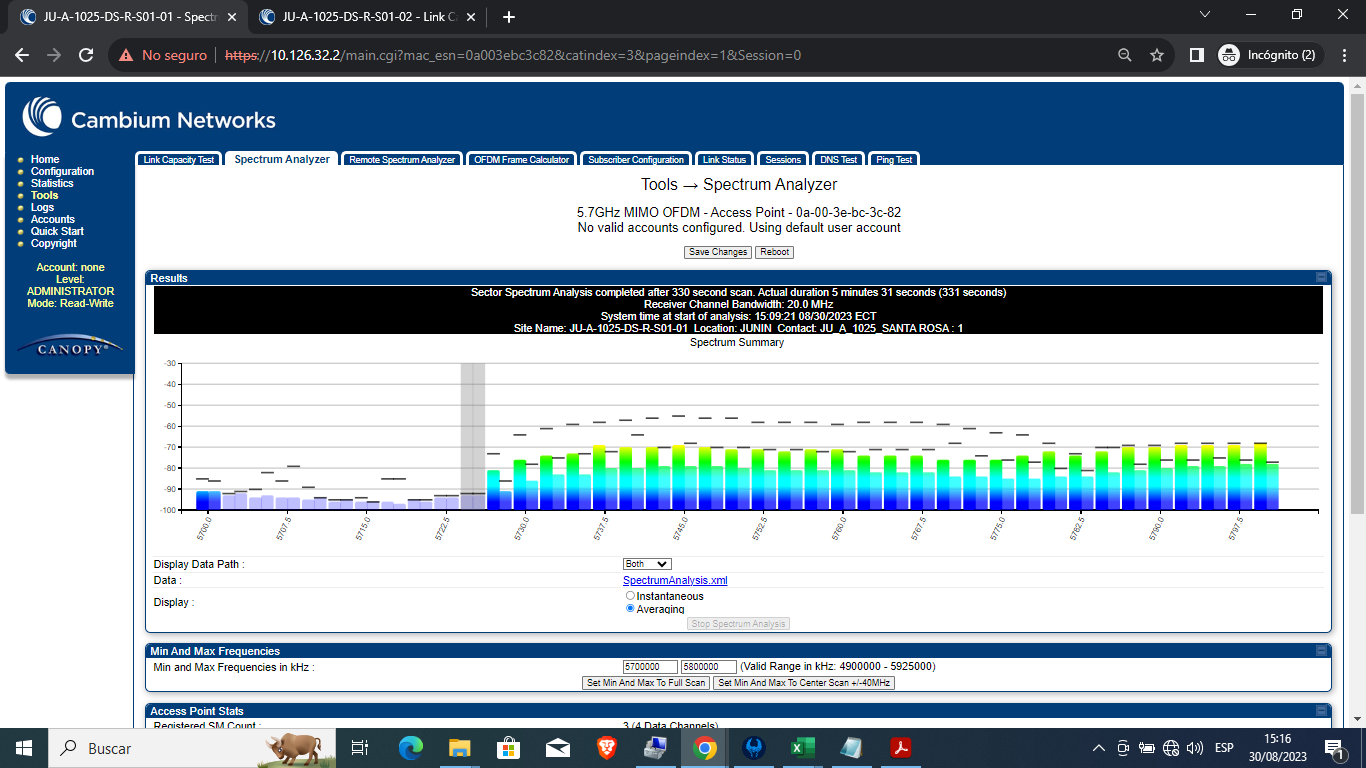
From what I can see there are three scans with the two in 5.2-5.4GHz and 5.8GHz looking pretty clean while the third scan in 5.8GHz looks noisy. If you’re in the FCC region the 5.8GHz band goes up to 5850Mhz so you should scan an additional 50Mhz above the current range. That particular AP may be best served operating in a different band given the noise in 5.8GHz. I don’t know how these scans are related and don’t fully understand the initial question still. Sorry.
Thanks for the explanation, it was just what I wanted to understand. At work I must do continuous spectrum analysis in several places with different APs.
What really jumps out at me is the difference in how the data is displayed. Took me a sec to realize that you have different spectrum ranges selected. For greater detail I’d recommend narrowing the scanned frequency down closer to where your AP is set. Scanning 5000-5800 yields lots of data, but more than you need usually.