Instead of the choosen reporting, Cambium should have this simple data in their Data or Graphic report (depending on time selected - DAYS, WEEKLY, MONTHLY)

This will show all the equipments in the Network (including all the sites)
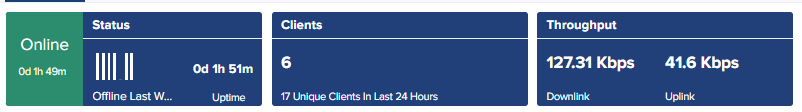
The screenshot below can be as example but to show total number of users and traffic usage on average (depending on time selected - DAYS, WEEKLY, MONTHLY)
Graphical reporting or data reporting are showing monthly but in graphical template its show only 7 days data. So even when we select monthly, it will follow the template that only showing 7 days data

