I've been using SNMP logs of our APs in an attempt to determine when they are nearing capacity (ie: don't add more SMs). However, in taking a closer look at Monitor->Performance today of an AP, I see the column "Downlink Capacity Packet Drops". Mine are all at 0 but is this a good place to watch? What exactly is going to show up in this column?

The Downlink Capacity Packet Drops indicates the number of packets for an SM ingressing the ethernet port of the AP that were dropped because there wasn't enough air capacity for that particular SM. This could be due to various reasons including poor RF conditions for that particular SM or a limited MIR setting. Doesnt necessarily mean AP is at capacity.
One quick way to determine if the AP is at capacity is to look at the Downlink Frame Time under the Monitor->Performance page.
Thanks,
Sriram
What does the number (percent) in downlink frame time represent? Is there a way to grab that via SNMP so I can track it over time and see trends, not just an instant snapshot?
This is looks intriguing. Feel like I might be the last guy to the party on this!
@Au Wireless wrote:
What does the number (percent) in downlink frame time represent? Is there a way to grab that via SNMP so I can track it over time and see trends, not just an instant snapshot?
This is looks intriguing. Feel like I might be the last guy to the party on this!
Its the amount of frame time used averaged over 5 seconds on the GUI. I'm speaking from memory here but there are two SNMP OIDs you can grab, dlWLanTotalUsedFrameTimePerSecond and dlWLanTotalAvailableFrameTimePerSecond. You can then calculate the used/available and get the frame utlization in the downlink. As you approach 70, 80, 90 % you can then determine that your AP is starting to approach capacity on the Downlink.
And before you ask, Uplink frame time is broken and that is why you don't see it on the GUI (beggining with 3.1). We have to rework the Uplink frame utilization mechanism and get it into a future release.
Thanks,
Sriram
3 Likes
Time to start teaching myself how to import these OIDs into PRTG and track this.
I'd love to be able to track the downlink frame % as a separate OID if that is possible. This will allow me to set alarms in our SNMP tool instead of trying to tack WLAN bandwidth use which is not a very effective way of determining capacity.
@Cambium_Sri wrote:
Its the amount of frame time used averaged over 5 seconds on the GUI. I'm speaking from memory here but there are two SNMP OIDs you can grab, dlWLanTotalUsedFrameTimePerSecond and dlWLanTotalAvailableFrameTimePerSecond. You can then calculate the used/available and get the frame utlization in the downlink. As you approach 70, 80, 90 % you can then determine that your AP is starting to approach capacity on the Downlink.
And before you ask, Uplink frame time is broken and that is why you don't see it on the GUI (beggining with 3.1). We have to rework the Uplink frame utilization mechanism and get it into a future release.
Thanks,
Sriram
I have imported these MIBs into my SNMP software and have been tracking them. I am having a difficult time using them either separately or together to track capacity and have them be very useful. If the "Total Frame Time Used %" number in the web interface is a good indicator of AP capacity, can that number, as a percentage, be made available as an OID? I am not able to get my SNMP software to do the calculations in realtime between the two OIDs you mentioned. While the data is there, it is not easy to parse or see trends. Since you are already creating the data and making it available in the web interface, I hope it would be possible to get that output via SNMP.
Chad
Hello,
is "Total Frame Time Used %" now available in the last fw releases or are there plans for this?
That would be a great KPI to add in the monitoring software of our networks.
kind regards
Rocco
Hello,
It is currently available only for the DL portion of the frame. UL portion was removed due to a defect and it is still not available.
Regards.
Hi Luis,
do you mean an OID is available for that counter (the ratio in %)?
From which realease of your epmp fw and which is that OID?
Thank you
Rocco
Hello Rocco,
OID .1.3.6.1.4.1.17713.21.2.1.113.0
Range =[1..1000] 0.1% =1;100% =1000
This OID will give you the same value displayed in the Monitor->Performance page, under "Total Frame Time Used" for DL but times 10.
Example:
OID returns: 371
Interpretation: 37.1% of the DL portion of the frame is being utilized
Regards
2 Likes
Hi Luis,
thank you for the details but it seems that the involved OID isn't available in our APs with fw 2.6.1.
Was it introduced in a following release?
Rocco
Hi Rocco,
You are correct. It was not introduced until version 3.3.
Regards
That parameter is available in Cloud version of cnMaestro?
Is it possibile to create an alert once the AP go beyond a set threshold?
It's available in cnMaestro Cloud now, but the is the defect there.
It shows 10x times bigger value for Frame Utilization from real value.
It's already fixed and the cnMaestro Cloud will be updated soon.
Thank you.
This may be obvious for some but I thought I would add how im tracking AP capacity % in PRTG using Sensor Factory as it was mentioned previously in this thread.
First add individual OIDs for both on each specific AP:
dlwlan total available frame time per second
&
dlwlan total used frame time per second
Then create a Sensor Factory sensor with parameters below
#1:dlwlan total available frame time per second[]
Channel(sensorID-A,channel-B)
#2:dlwlan total used frame time per second[]
Channel(sensorID-X,channel-Y)
#3:AP capacity %
( Channel(sensorID-X,channel-Y) / Channel(sensorID-A,channel-B) )
After creation, then edit settings of both "dlwlan total available frame time per second" & "dlwlan total used frame time per second" channels and under "Graph Rendering" select "Hide from Graphs"
And finally, edit settings of "AP capacity %" channel and under "Data" select "Display in percent of maximum" and set maximum to "1"
Thanks to OP and mods for posting and stickying this thread. Ive been wondering how to do this for quite some time
1 Like
Hi all,
I also want to monitor the frame utilization, but I have a question with two OIDs:
-
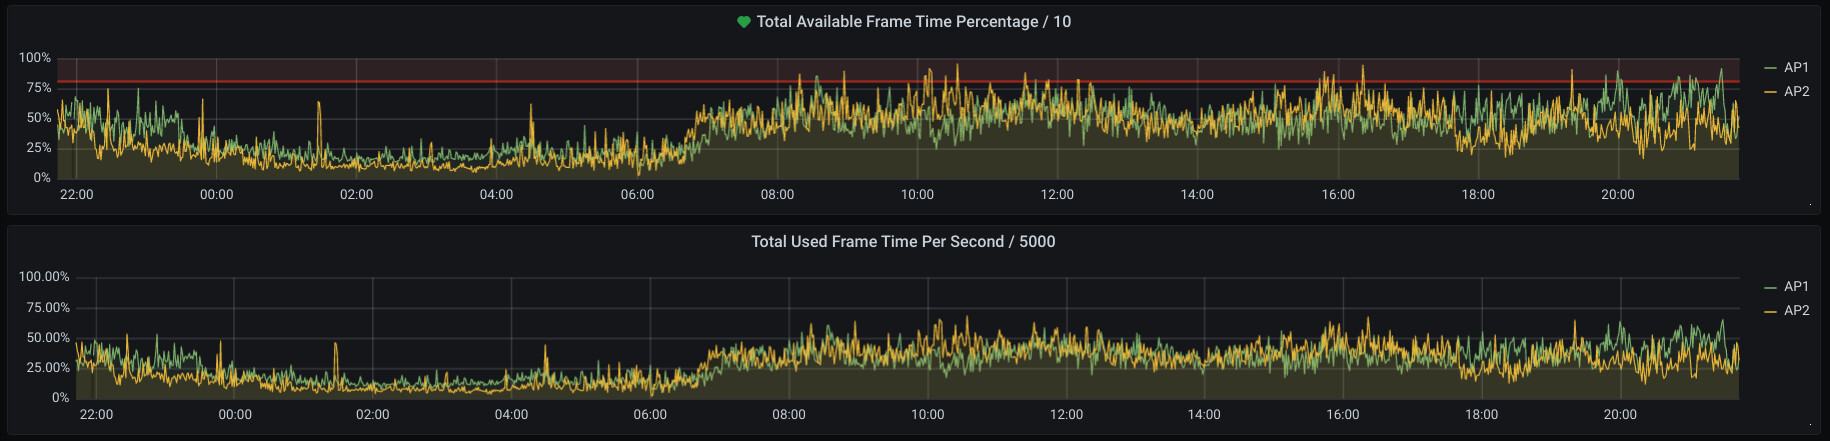
dlWLanTotalAvailableFrameTimePercentage/10
-
dlWLanTotalUsedFrameTimePerSecond/5000
Both paint the same shape / usage pattern, but the second option shows a lower utilization percentage than the first option.
Why? Which is the correct one to use?
Thanks!
One is total available frame and the other is total frame use. If the first one is low and the second is high then your AP is getting close to full.
Something doesn’t make sense for me:
Both values correlates in the same direction, but should be in opposite direction, isn’t?
No, looks correct. You are not preprocessing the first one to invert it as a function from 100% so it looks correct.
Think of it this way: at any given time you have only so much of the frame available to pass new data, some of the frame is used for retransmissions and some for control info (GPFs). The first graph is showing you how much of the frame can be used by client data and the second one shows how much was used.
As you add more SMs to an AP, the top graph will get smaller while the bottom graph will get larger. Eventually you will hit the point that the average frame use to availability ratio hits 1:1 and you cant add any more SMs tk that AP.